라벨이 matplotlib인 게시물 표시

파이썬[Python]: matplotlib - axis 함수

이미지
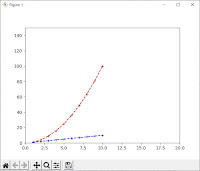
matplotlib 모듈 - pyplot 모듈 - axis 함수(function) /// 설명 축(axis) 속성을 설정하거나 가져올 경우 유용합니다. [xmin, xmax, ymin, ymax] : float emit : 축(axis)을 변화시킬 경우 옵저버(observer)에게 통보 하는 것을 결정합니다. set_xlim 또는 set_ylim 에 사용되어집니다. ※ 형식 matplotlib.pyplot.axis(*args, emit=True, **kwargs) reference https://matplotlib.org/stable/api/_as_gen/matplotlib.pyplot.axis.html /// 예제 default x = [0 ~ (y'length - 1)] 1 2 3 4 5 6 7 8 9 10 11 12 13 14 15 16 17 18 19 import  matplotlib.pyplot  as  plt   x1  =  [ 1 ,  2 ,  3 ,  4 ,  5 ,  6 ,  7 ,  8 ,  9 ,  10 ] y1  =  [ 1 ,  4 ,  9 ,  16 ,  25 ,  36 ,  49 ,  64 ,  81 ,  100 ]   x2  =  [ 1 ,  2 ,  3 ,  4 ,  5 ,  6 ,  7 ,  8 ,  9 ,  10 ] y2  =  [ 1 ,  2 ,  3 ,  4 ,  5 ,  6 ,  7 ,  8 ,  9 ,  10 ]   # plt.plot(x1, y1, 'r+--', x2, y2, 'b+--') plt.plot(x1, y1,  'r+--' ) plt.plot(x2, y2,  'b+--' ) plt.axis([ 0 ,  20 ,  0 ,  150 ]) plt.axis( 'on' ) # plt.axis('off') # plt.axis('equal') # ... # ... see: https:

파이썬[Python]: matplotlib - plot 함수

이미지
matplotlib 모듈 - pyplot 모듈 - plot 함수(function) /// 설명 x에 대응하는 y를 선이나 마커로 표시합니다. ※ 형식 matplotlib.pyplot.plot(*args, scalex=True, scaley=True, data=None, **kwargs) reference https://matplotlib.org/stable/api/_as_gen/matplotlib.pyplot.plot.html /// 예제 default x = [0 ~ (y'length - 1)] 1 2 3 4 5 6 7 8 import  matplotlib.pyplot  as  plt   y  =  [ 1 ,  2 ,  3 ,  4 ,  5 ,  6 ,  7 ,  8 ,  9 ,  10 ] plt.plot(y) plt.show()   # y'length = default x' length   Colored by Color Scripter cs /// 출력 /// 예제 x, y 1 2 3 4 5 6 7 8 9 10 11 12 13 14 15 import  matplotlib.pyplot  as  plt   x  =  [ 1 ,  2 ,  3 ,  4 ,  5 ,  6 ,  7 ,  8 ,  9 ,  10 ] y  =  [ 1 ,  4 ,  9 ,  16 ,  25 ,  36 ,  49 ,  64 ,  81 ,  100 ]   plt.plot(x, y,  'r+--' ) plt.show()   # y'length == x' length # # plt.plot(x, y, 'r+--') #                [fmt] = 'r      +       --' #                         color  makers  line_styles #                see: https://matplotlib.org